Keeping your systems safe starts with understanding your data. Data visualization helps you see patterns, threats, and risks quickly. It turns complex security data into clear, useful charts and graphs. With the right tools and tips, you can make smarter decisions.
This blog will show you simple ways to use data visualization for better security insights. Get ready to boost your cybersecurity with the power of visual data.
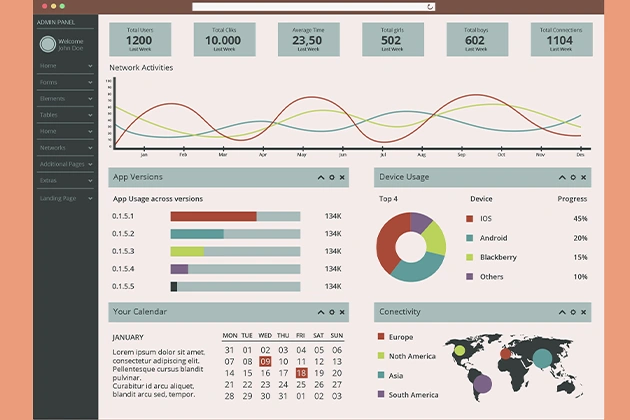
Use Dashboards to Monitor Real-Time Threats
Dashboards can display live data in one centralized location. You can track threats, user activity, and unusual events fast. They help you react to problems right away.
Keep your dashboard clean and simple. Use graphs and alerts to highlight key issues. Real-time updates make sure you don’t miss anything important.
Dashboards are great for busy teams. They give quick insights with less digging. They also help you focus on what matters most.
Visualize User Activity Logs
User activity logs can reveal strange behavior. Use bar charts or timelines to show login times and access points. This helps you find possible breaches fast.
Look for spikes in activity or logins at odd hours. These could be signs of a compromised account. Visual displays make spotting these easy.
Add filters to zoom in on specific users. This helps with tracking suspicious actions. It also supports better internal audits.
Map Network Traffic for Better Visibility
Network security visualization tools can show how data flows across your system. Use line graphs or flow maps to see which devices talk to each other. This helps detect unusual connections.
If a server communicates with an unknown IP, it could indicate a security issue. A good visual tool will show this right away. That lets you act fast.
Try to monitor traffic during off-hours. Strange activity at night can be a red flag. Maps make those patterns easy to spot.
Compare Threat Data Over Time
Trends tell a powerful story. Use line charts to compare attacks week by week or month by month. It shows if threats are rising or falling.
Look for patterns in malware or access attempts. If one keeps growing, it needs attention. Seeing this over time makes planning easier.
This kind of chart also helps with reporting. You can show progress or risk clearly. That supports smarter security planning.
Highlight Top Vulnerabilities with Heatmaps
A heatmap shows which areas are most at risk. Use colors to mark high, medium, and low vulnerabilities. This gives a quick overview of weak spots.
Scan results can be overwhelming in a list. A heatmap turns them into something you can act on fast. That saves time and stress.
Review heatmaps regularly. Fix the most dangerous issues first. This keeps your system safer.
Use Geolocation Charts for Attack Origins
Geolocation charts show where attacks come from. You can track threats by country or city. It helps with spotting patterns in cybercrime.
Visual threat detection becomes easier with maps. You might find that most threats come from one region. That insight can guide your next steps.
Update your charts often. Threats change and move. A fresh chart gives better protection.
Show Access Levels with Clear Charts
Knowing who has access to what is key. Use pie charts or flow diagrams to show user permissions. This helps find problems with access control.
Too many users with admin rights are risky. A visual chart makes that easy to see. It supports better role-based access planning.
These charts are also helpful for conducting audits. They give a quick view of who can do what. That means stronger internal security.
Track Phishing Attempts with Line Graphs
Phishing is still a big threat. Use line graphs to track how often it happens. You can spot spikes and trends over time.
If there’s a sudden rise in phishing attempts, you need to act. A clear chart makes this obvious. It helps you plan your response.
You can compare different teams or departments as well. See who gets targeted most. That tells you where to train or strengthen defenses.
Visualize Security Tool Performance
Your tools should protect you, not slow you down. Use bar charts to see how well your security analytics tools perform. You can track alerts, blocks, and false positives.
Look for tools with too many false alarms. That wastes time. Charts make it easy to compare tool performance.
This data supports smarter buying decisions. Keep what works, and replace what doesn’t. Data visualization makes those choices easier.
Simplify Reports for Non-Technical Teams
Not everyone speaks tech. Use simple visuals to explain risks and threats to managers or other teams. This builds support for security.
Pie charts, timelines, and maps are easy to understand. They make complex data simple. That means better communication and faster decisions.
When teams understand the risks, they help fix them. Visualization connects people to the problem. That improves overall cybersecurity.
Use Chart Tools to Build Your Brand
Sharing clear visuals also helps with personal branding. If you work in cybersecurity, charts can show your skills. You can share insights with clients, employers, or on social media.
One great tool is Adobe Express. Make sure to check out this chart creator to market yourself. It helps you build sharp, useful charts fast.
Data-driven cybersecurity professionals stand out. Visuals show your knowledge and work clearly. That can lead to more trust and new opportunities.
Regularly Review and Update Visuals
Data is not static, and neither should your visualizations be. Regularly review your visuals for consistency and accuracy. Outdated or irrelevant data can mislead decision-makers.
Set a structured timetable for updates. This could be weekly, monthly, or quarterly, based on specific needs. Keeping data fresh ensures clarity and relevance for stakeholders.
Regularly updated visuals accurately reflect the current threat landscape. This promotes informed and effective decisions among the team. Staying ahead can significantly enhance security responses.
Take Action with Smart Security and Data Visualization
Data visualization helps make complex security data clear and easy to understand. It lets you find threats faster and make smarter choices. Using charts and graphs saves time and improves your security plan. With the right tools, you can turn data into action.
These tips can help protect your systems better. Always keep your visuals updated for the best results. Good data visualization means fewer risks. Start using it today to stay ahead of cyber threats.
Did you find this article helpful? Visit more of our blogs.