What is Graph Analysis?
Graph analysis is a methodical approach to understanding the relationships and patterns among interconnected data points. At its core, it represents data as a graph consisting of nodes (or vertices) and edges (the connections between nodes). This representation aids in visualizing and analyzing the complex relationships existing within the data. Furthermore, effective graph analysis can uncover hidden structures and insights, leading to better-informed decision-making in various fields such as social networking, biology, and finance.
Key Concepts and Terminologies:
- Node (Vertex): Represents an entity or a data point in the graph.
- Edge (Link): Connects two nodes, representing the relationship between them.
- Directed and Undirected Graphs: Directed graphs have edges with a direction, indicating the flow of the relationship, while undirected graphs have bidirectional or no specified direction of edges.
- Weighted and Unweighted Graphs: In weighted graphs, edges carry a value representing the strength or capacity of the connection, whereas unweighted graphs have edges without any associated weight.
The Process of Graph Analysis
The process of graph analysis is multifaceted and involves several key steps to effectively interpret and utilize the connections within data. Here’s a closer look at how this process typically unfolds:
- Data Collection and Preparation:
The initial phase involves gathering the necessary data and preparing it for analysis. This might include cleaning the data, identifying relevant entities, and defining the relationships that will form the nodes and edges of the graph.
- Graph Construction:
Once the data is ready, the next step is to construct the graph. This involves creating nodes for each entity and edges to represent the relationships between them. Depending on the nature of the data and the analysis requirements, the graph can be directed or undirected and weighted or unweighted.
- Analysis and Algorithm Application:
With the graph constructed, various algorithms can be applied to analyze the structure and extract meaningful information. Common algorithms include:
- Pathfinding algorithms (like Dijkstra’s or A* algorithm) are used to find the shortest paths between nodes.
- Clustering algorithms (like k-means or hierarchical clustering) are used to identify groups or communities within the graph.
- Centrality algorithms (like betweenness centrality or PageRank) are used to identify important nodes within the network.
- Interpretation of Results:
The final step involves interpreting the outcome of the graph analysis. This might include identifying key influencers in social networks, optimizing logistics routes, or detecting patterns of fraud in financial transactions.
- Visualization:
Visualizing the graph and the analysis results can provide intuitive insights and make complex relationships more understandable. If you want a simple way to visualize key insights or present data clearly, you can also try this free tool to generate clean, customizable donut charts for reports and presentations. Tools like Tom Sawyer Software’s Perspectives platform excel in this area, offering powerful visualization capabilities that help interpret and present the data effectively.
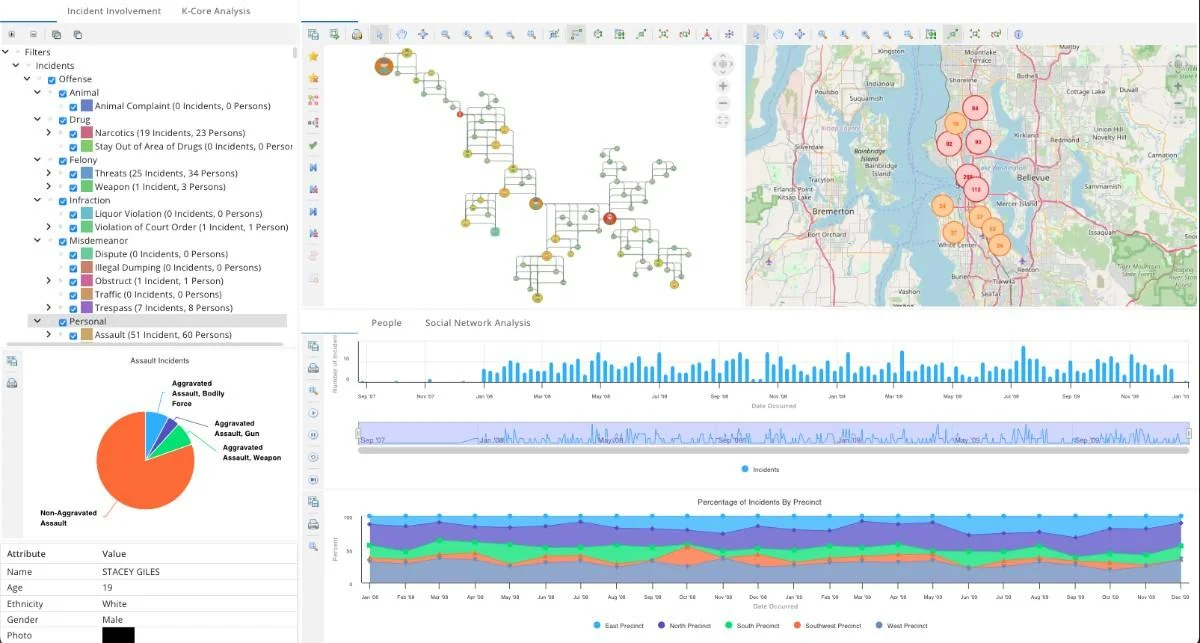
A graph visualization and analysis of a criminal network produced with Tom Sawyer Perspectives.
Benefits of Graph Analysis
Graph analysis offers numerous advantages across various fields:
- Enhanced Decision-Making:
- By revealing hidden patterns and connections in data, graph analysis aids organizations in making informed decisions.
- It enables the identification of influential entities and key relationship patterns, which are crucial for strategic planning.
- Improved Efficiency:
- In sectors like logistics and transportation, graph analysis optimizes routes, reducing costs and time.
- Network optimization leads to more efficient resource allocation and management.
- Advanced-Data Insights:
- Provides a deeper understanding of data structures and relationships, allowing for more nuanced analysis than traditional data analysis methods.
- Helps in detecting anomalies and identifying trends, which is particularly useful in areas like cybersecurity and market research.
Graph Analysis Tools and Technologies
Graph analysis demands robust tools and technologies to manage the complexity and scale of network data.
- Open-Source Software:
- Tools like NetworkX, Gephi, and Graph-tool offer functionality for graph construction, analysis, and visualization. They are widely used in academic and research settings.
- Commercial Solutions:
- Companies often turn to commercial software for more comprehensive support and advanced features. These tools, such as Neo4j, GraphDB, and Tom Sawyer Perspectives, provide extensive capabilities for large-scale and complex graph analyses.
- Cloud-Based Platforms:
- Cloud services like Amazon Neptune and Microsoft Azure Cosmos DB offer managed graph database services that scale easily and provide robust analysis capabilities.
Tom Sawyer Perspectives stands out in the field of graph analysis for several reasons:
- Advanced Visualization:
- It offers superior visualization capabilities, enabling users to create intuitive and interactive graphs that make complex data more accessible and understandable.
- Comprehensive Analysis Features:
- The software provides a wide range of analysis tools, supporting various graph algorithms and enabling users to extract meaningful insights from their data effectively.
- Scalability and Integration:
- Designed to handle large-scale data, it can easily integrate with other systems and databases, making it a versatile choice for organizations of all sizes.
- Industry-Agnostic:
- Tom Sawyer Perspectives flexible platform is designed for different industries, making it suitable for sectors such as finance, healthcare, and engineering.
Future Trends in Graph Analysis
Graph analysis is rapidly evolving, driven by tech advancements and growing data complexity. Key future trends include the integration of AI to boost analytics and decision-making, enhanced scalability for real-time, large-scale network analysis, and improved visualization for deeper data insights. Additionally, its application will expand across various sectors, emphasizing the need for robust data security and privacy measures. This evolution positions graph analysis as a crucial tool for deciphering complex data patterns and driving innovation across industries.